Cost Optimization in Kubernetes

Ensono
A guide to logically synchronizing the Kubernetes Cluster Auto-Scaler
Kubernetes is a powerful and ubiquitous utility that is currently empowering enterprises and small businesses alike to transform the way they deliver software as well as manage their applications and development. Even though there are other container technologies available, Kubernetes really stands out from the others in its ability to be extended through the concept of controllers as well as its excellent API, allowing it to be integrated with other technologies. The downside to Kubernetes (which becomes evident when companies first began the journey towards adoption) is its complexity. There are aspects to Kubernetes which diverge from some of the more traditional or even some of the more neo-traditional cloud infrastructure concepts such as auto-scaling groups. One of these points of complexity, which we will be covering in this article, is the way in which Kubernetes scales for utilization (or said another way, auto-scales).
As a quick aside, it feels a little strange, even for this writer, to refer to cloud infrastructure as traditional, but when you think about it, auto scaling groups in AWS have been around for almost a decade. Considering, however, that Kubernetes really is the next generation of cloud infrastructure, I’ll refer to some of the cloud infrastructure or platform-as-a-service features of AWS and other clouds as traditional in contrast to Kubernetes for the purposes of conversation.
Another point worth noting here is that many of the concepts that we will cover in this article are relevant for multiple clouds. This is due to the fact that Kubernetes has seamless integrations with the various types of cloud infrastructure that it can run on. Many of these cloud infrastructure providers have direct integrations with the Kubernetes Cluster Autoscaler. These seamless integrations allow us to speak to some of these points agnostically, though there is some nuance using these techniques within specific clouds, whether that be AWS, Azure, or GCP.
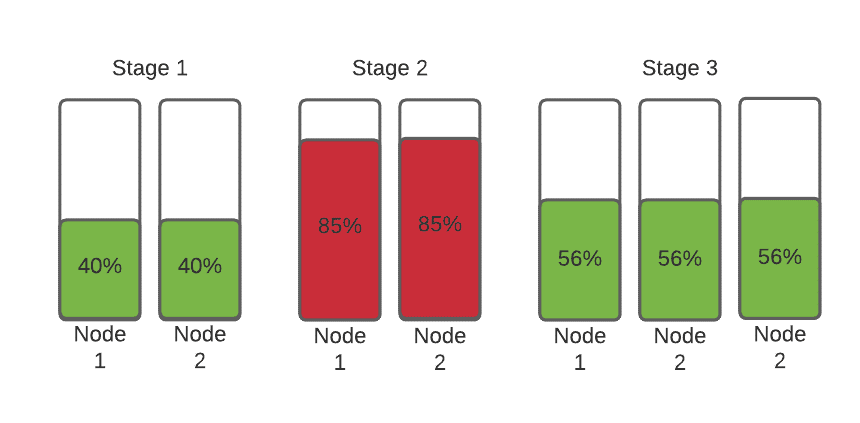
So back to the topic at hand: auto-scaling. In the graph below we see an example of how a “traditional” auto scaling group in AWS would work with a scaling threshold set at 80%. We see in the first stage, the nodes are running at 40% and purring along nice and healthy. In stage two, we see an increase in traffic causing the nodes to go over 85% utilization of their processors. At this point, the auto-scaling feature would kick in and add a node to the auto scaling group, reconfigure the load balancer and distribute traffic across all three nodes of the cluster, thereby reducing the average utilization on all nodes to about 56%.
This is normal and expected behavior, but as we mentioned earlier, Kubernetes is a little bit more complex. We mentioned that Kubernetes has the ability to be extended with the concept of controllers. Controllers are modules that are integrated into Kubernetes either by third parties or by community developers of Kubernetes. One such controller, called the Cluster Autoscaler (CA), is responsible for communicating with the underlying platform to add new nodes to a node pool. Here’s the catch: Cluster Autoscaler does not use CPU utilization of the nodes to determine whether or not new nodes are required in the node pools. Instead, Kubernetes uses the “requested” resource values. To understand this concept, let’s dive a little bit further into the concept of pods and how they request resources.
A pod is the term that Kubernetes uses to describe a container. If we were to get technical, it’s possible for a pod to have multiple containers but, for the purpose of simplicity, let’s assume in our theoretical cluster, that each of our pods has one container.
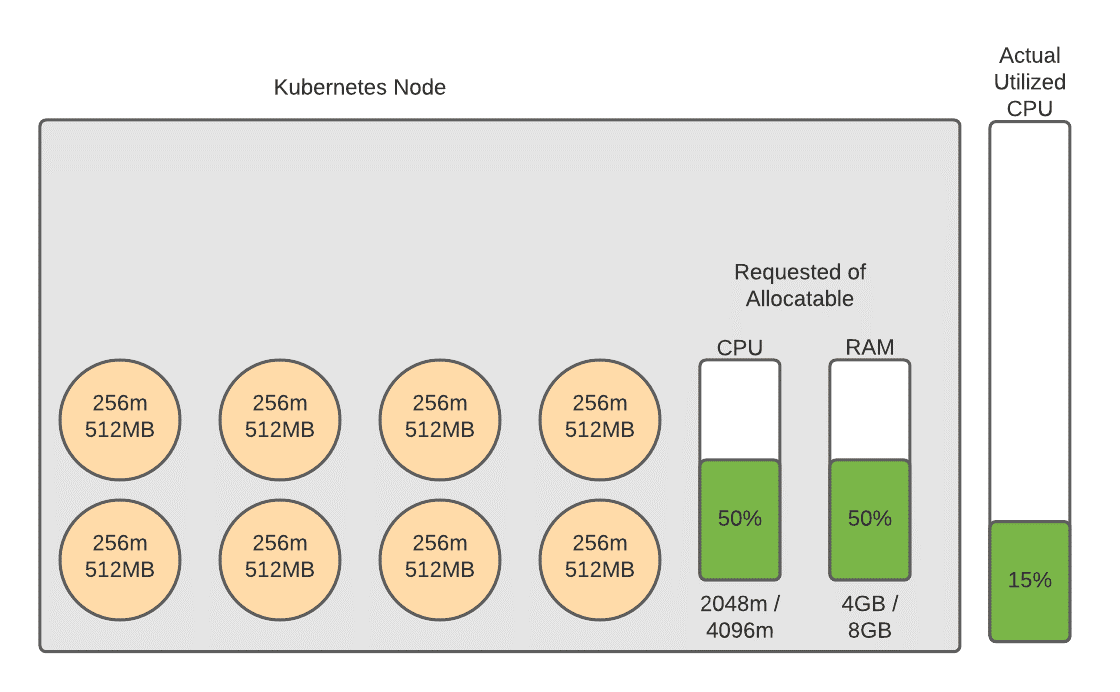
In the diagram below you’ll see a graphical depiction of a Kubernetes node. We have eight pods running on this node, each pod requesting 256 millicores (a designation meaning 1/1024th of a core), and 512 megabytes of RAM. When a pod is defined by a developer or Kubernetes administrator, the administrator will define the amount of millicores and RAM that the pod requests. This is basically a way for the Pod to tell the Kubernetes cluster that it needs at least this much amount of resources to run. This helps the Kubernetes cluster understand if it has enough resources to allow the pod to run, as well as which specific node to run the pod on based on the requests of the pods on that node.
To the right of the Kubernetes node block you will notice that there is another bar showing that this node is 15% utilized. This is where the concept gets a little bit tricky. For the purposes of this conversation we are assuming that this node has traffic on it. If you were to view the CPU utilization at the infrastructure level (CloudWatch on AWS for example), you would see that this node is 15% utilized. But as you can see in the smaller bars on the server block, we are requesting half of the server’s resources. Again, the requests are simply requests and are not actually indicative of the processor timeshares that the container is using. Bear with me now because this will start to make sense as we move through this logically.
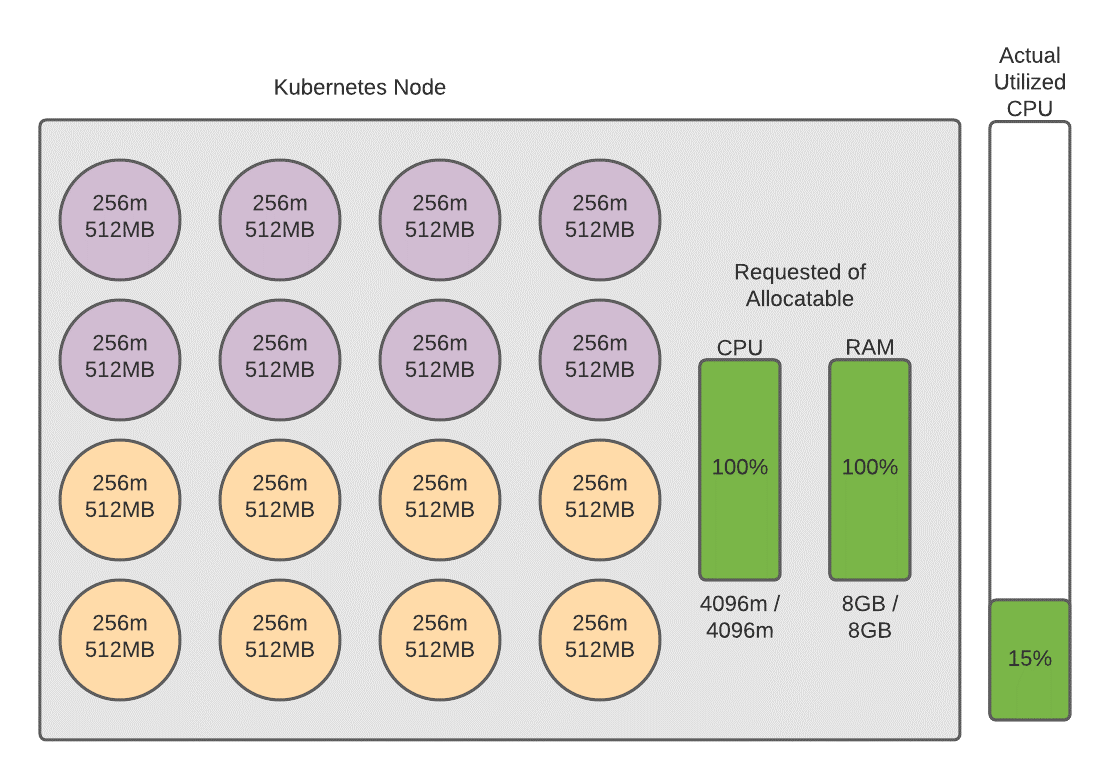
Now let’s assume that one of our administrators launches a new application in the cluster and this cluster decides to launch an additional eight pods associated with this new application on this node. This new application’s containers are depicted by the purple circles in the below diagram. This is a new application and is not driving any additional traffic, but the pods are still requesting a certain amount of resources from the node. Now we have reached a curious state. From the perspective of the Kubernetes Cluster Autoscaler this node is fully utilized. This means that Kubernetes can no longer schedule containers on this node because it believes this node is fully saturated and not available to handle any additional workloads. From the perspective of the infrastructure provider, however, this instance is still only 15% utilized. This leaves 85% of the server that could be utilized, and is paid for, but is not used. This 85% represents an inefficiency that we should try to rectify if we want to be cost effective. This is a challenge that plagues many Kubernetes clusters and is one that I’ve run into quite a few times.
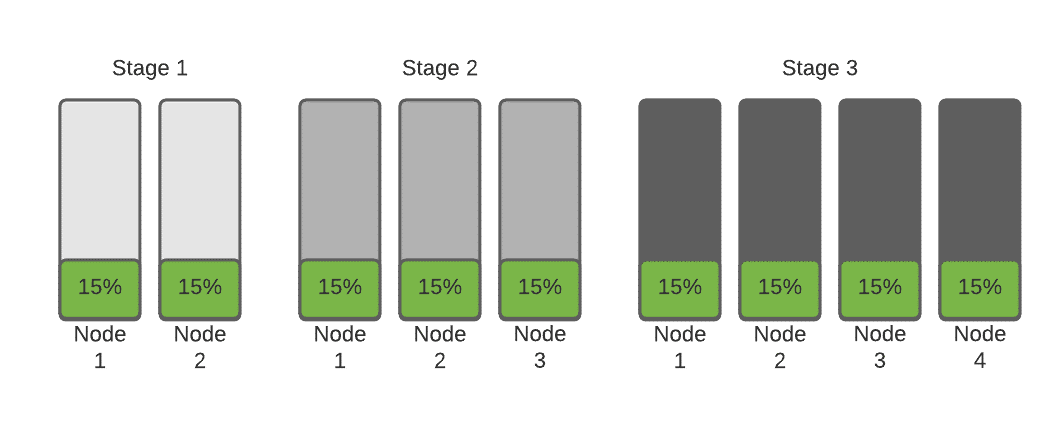
As additional pods are requested within the cluster, the Cluster Autoscaler will be triggered to add additional nodes to the pool to handle the additional requests, but we will see a linear progression of utilization that is not conducive to cost optimization. The graph below shows how the Cluster Auto-scaler will grow the cluster over two cycles of this growth.
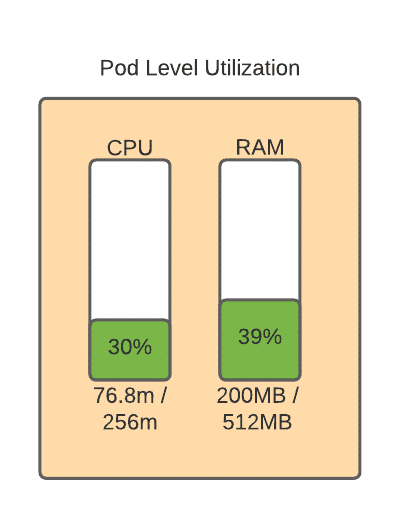
As you can see, the more pods that are added (either through HPA or through administrative changes), the more waste accumulates. So, what do we need to do to rectify this? Simply put, we need to tune our resource requests, but of course with Kubernetes nothing is that simple. To understand how to appropriately tune our pods, let’s dive one level further and see what’s going on inside one of these pods. What you’re looking at in the graph below is the “observed utilization” of the pod itself. Because of the way that Kubernetes calculates utilization using millicores, the observed utilization is the percentage of millicores that the container is actually using on the host processor, divided by the amount requested. Since we requested 256 millicores, and the container is using 76.8 of those millicores, we can derive that this container is using 30% of what it is requesting in CPU, and 50% of the requested RAM value.
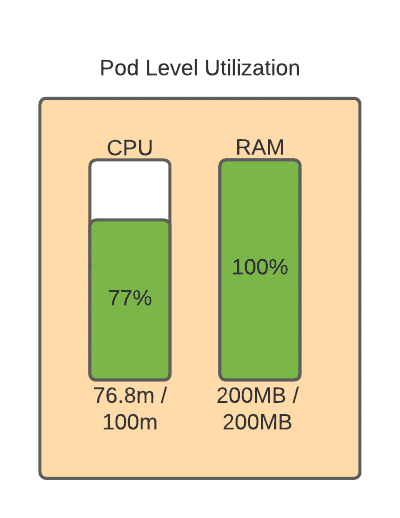
So, let’s tune this value a little bit and then run back up to the chain and see what effect that has had in our cluster. First, we adjust this at the pod level. Don’t worry about the RAM utilization being at 100%. The container can use more compute and RAM than it requests, so long as you don’t set any resource limits on the container and the resources are available on the host.
Let’s see the effect that this had on our cluster. You can see that we have the same amount of pods now and the same amount of actual utilized CPU at the infrastructure level, but the percentage of the allocable resources that are requested now on the cluster has dropped to 39%.
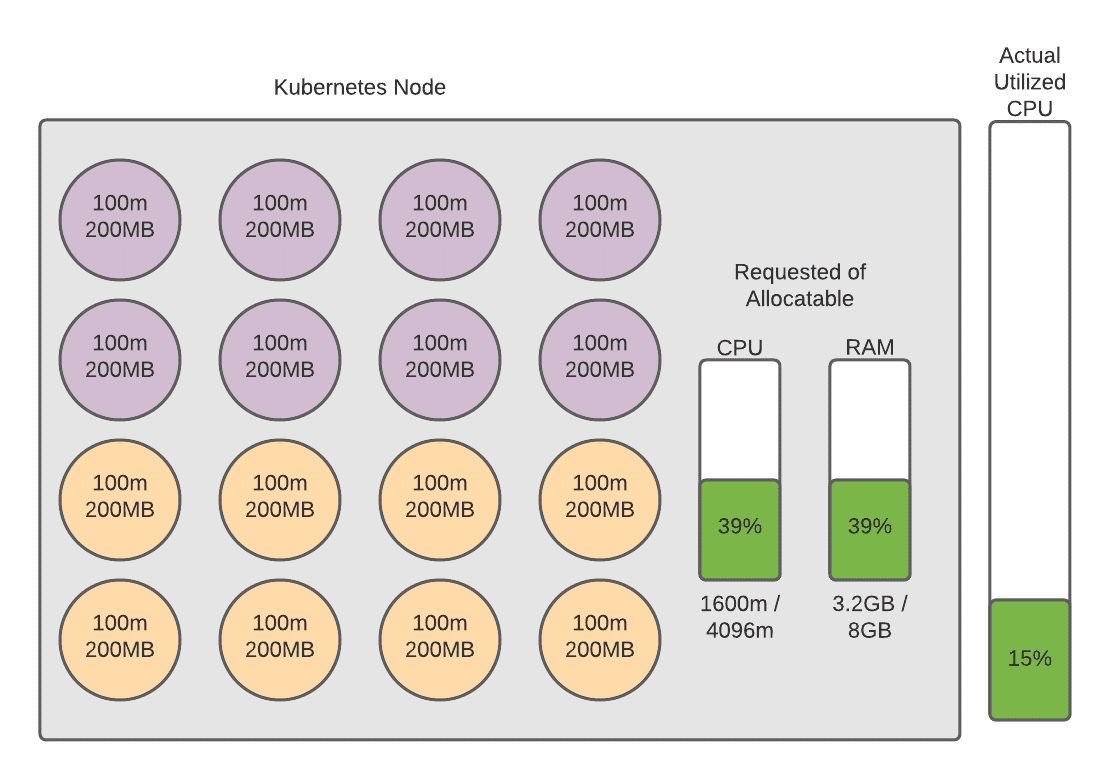
In this scenario, the cluster would not have to add additional nodes to handle additional traffic or to add applications or pods. In fact, let’s run a scenario in which our new application starts to receive traffic and we have downsized our nodes to half of what they were before.
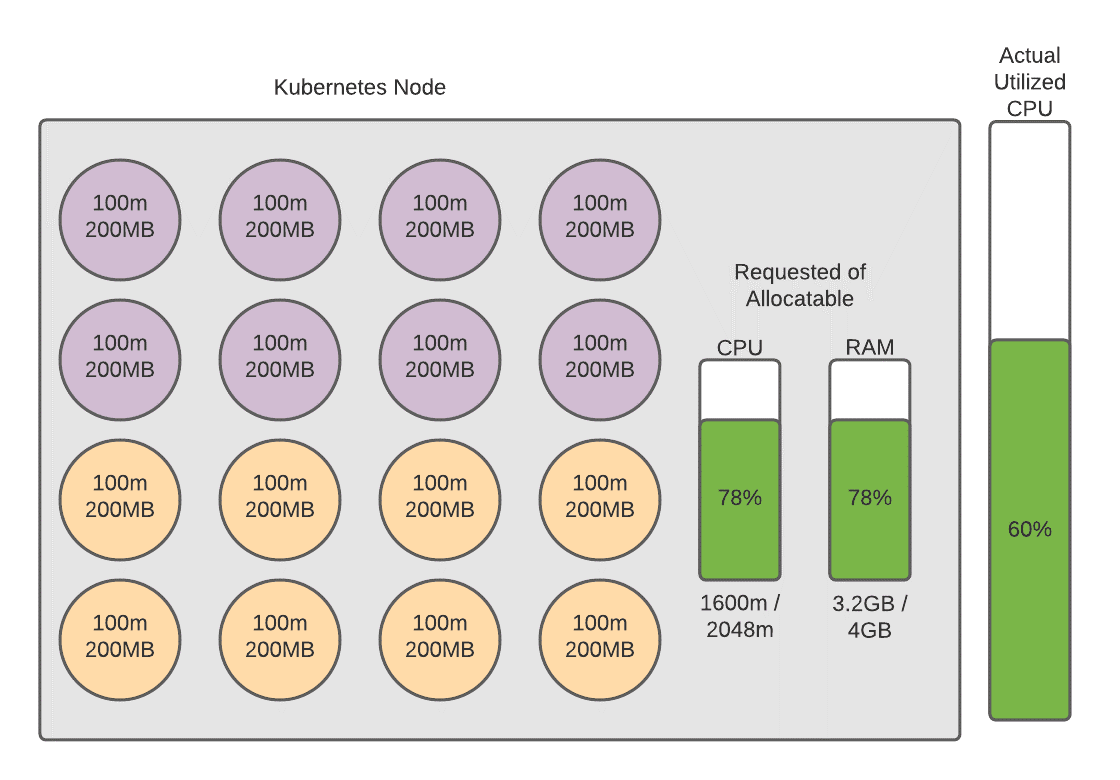
We have now tuned our cluster to a point where we are using more of what we are paying for so we are more cost-effective and at our current utilization levels we can afford to take spikes in traffic without having to add additional nodes. Paired with a horizontal pod auto-scaler, which adds pods when the average utilization of the pods in a specific deployment reach a target criteria (like observed utilization), this cluster should now be able to scale in a way that is more cost-effective. There are quite a few variables and aspects to this concept that we didn’t have time to cover in this article, including the horizontal pod auto-scaler and the various metrics that you can use for triggering scaling actions. Here are a few links that you can use to learn more about these concepts and apply them in your production clusters.
https://docs.aws.amazon.com/eks/latest/userguide/cluster-autoscaler.html
https://kubernetes.io/blog/2016/07/autoscaling-in-kubernetes/
https://kubernetes.io/docs/tasks/run-application/horizontal-pod-autoscale/
We hope you found some value in this article. If you have any questions or would like to learn more about how you can apply Kubernetes in your enterprise, please feel free to reach out to us.
Social Share
Don't miss the latest from Ensono
Keep up with Ensono
Innovation never stops, and we support you at every stage. From infrastructure-as-a-service advances to upcoming webinars, explore our news here.
Blog Post | May 5, 2026 | Technology trends
We’ve Seen This Movie Before: What Cloud First Taught Us About AI First
Blog Post | April 16, 2026 | Industry trends
Why Modern Private Cloud Is Back—and Why That’s a Good Thing
Blog Post | April 16, 2026 | Industry trends